How close is this to the real lake?
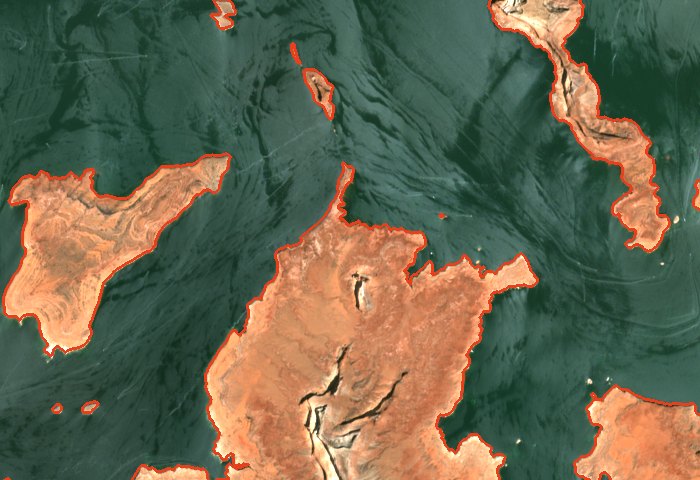
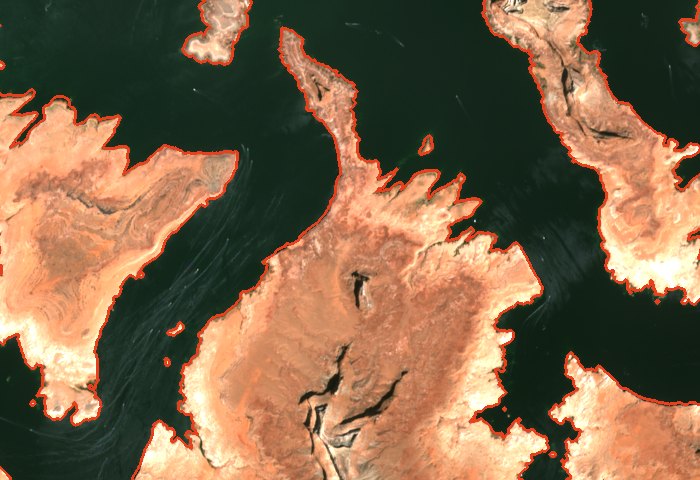
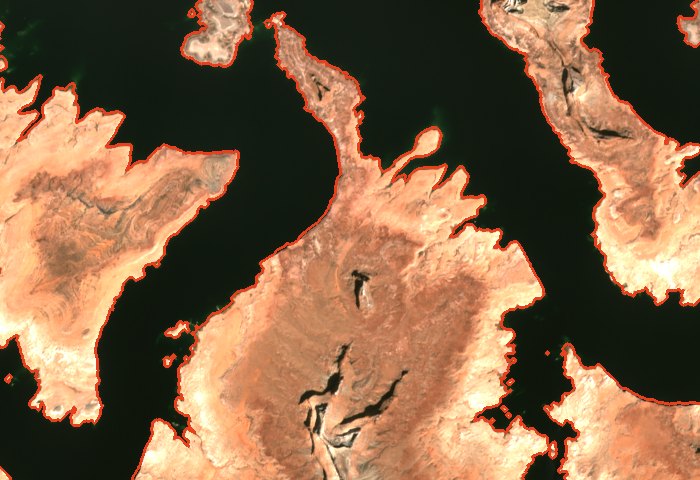
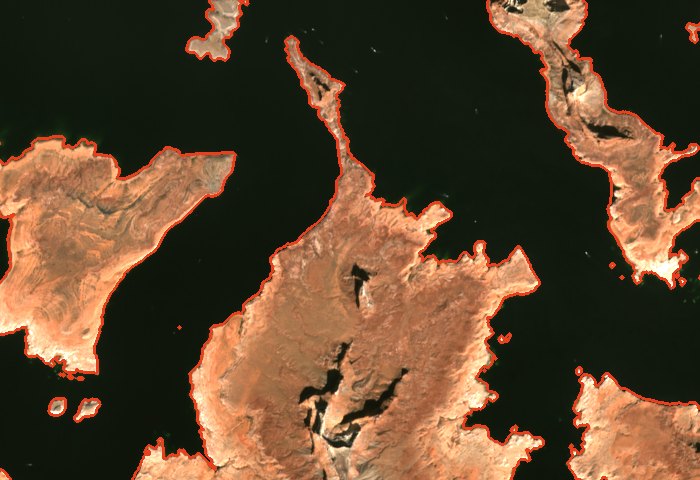
This app floods a terrain model to whatever elevation you set and draws the shoreline that results. Whether that shoreline is right is a question with an answer, because satellites photograph Lake Powell every five days and have done since 2015. This page is that comparison, on five dates spanning ninety feet of reservoir elevation — including one from six days before the study was run.
The test
The reservoir's own gauge record could not be reached from the machine this study ran on, so the test is run backwards. Take a cloud-free Sentinel-2 scene from a known date. Pull the water out of it with NDWI — the normalised difference of the green and near-infrared bands, which separates water from rock sharply — and, where the water is so dark that NDWI is only noise, with the scene classification that comes with the photograph, taken only where the near infrared is dark as water is. Leave out whatever the classification says was under cloud. Keep the largest connected body, which is the lake. Then flood our own terrain model to one elevation after another and ask which one reproduces that body best.
Two things then say whether the terrain is any good. A faithful model has one clearly best elevation; a distorted or misregistered one fits equally badly everywhere. And the best fit has to actually agree — measured here as intersection over union, the shared area divided by the combined area, where 1.000 is a perfect match.
Each curve is one photograph. The peak is the elevation that photograph says the lake was at; how narrow the peak is, is how precisely the photograph pins it down. The high stand of 2019 has the broadest peak, and it should: at a full reservoir the shoreline sits against steep canyon walls, so it takes more feet of water to move it a given distance across the ground.
The results
| Photograph | Fitted elevation, NGVD 29 | Agreement | Mean offset | Within 1% of best |
|---|---|---|---|---|
| 2019-07-17 | 3,621 | 0.967 | 12 m | 3,614–3,625 |
| 2022-08-10 | 3,536 | 0.966 | 10 m | 3,532–3,540 |
| 2023-04-17 | 3,522 | 0.963 | 11 m | 3,516–3,526 |
| 2023-09-24 | 3,575 | 0.963 | 12 m | 3,571–3,579 |
| 2026-09-03 | 3,520 | 0.958 | 11 m | 3,515–3,523 |
Mean offset is the disagreement area divided by the length of shoreline in the window — the average width of the band between our line and the photograph's. On all five dates it is 10 to 12 metres, along 230 to 310 kilometres of shoreline. The terrain model is sampled at 15 metres. The simulated shoreline is therefore landing inside one cell of the data it is drawn from, which is as close as this model can be asked to come.
These are the fourth set of fits. The first, on the same five photographs, agreed less — 0.849 to 0.952 — and the high stand of 2019 was the worst of them, 47 metres out and fitted twelve feet low. Its shoreline ran through the band where the terrain model had no measured ground at all: above the 2017–18 sonar survey and below the level at which 3DEP had mapped the lake's surface as if it were ground. That band has since been filled with 3DEP lidar flown in 2020–24, when the lake stood 100 to 170 feet down and most of it was dry, and with it every photograph agreed better, 2019 most of all. The third set changed how the water is read rather than the terrain. NDWI alone had read the darkest open water as land — deep and clear, both bands at the floor of what the sensor records — and that, not turbid inflow, was what cost 2023-04-17 its agreement: 0.861 and 38 metres before, 0.962 and 11 metres now, fitted one foot lower. 2023-09-24 went from 0.921 to 0.961. The fourth changed the terrain again, but only the ground no survey measured — the gaps in the sonar and the lakebed the lidar rebuild interpolated — which sat too low and flooded. It was raised to the level other photographs, never these five, show it dry at: 158 dates since 2017, 40 of them used. Agreement rose on every date here, to between 0.958 and 0.967. The audit that found it, and every number behind it, is docs/waterline-audit.md.
The photographs
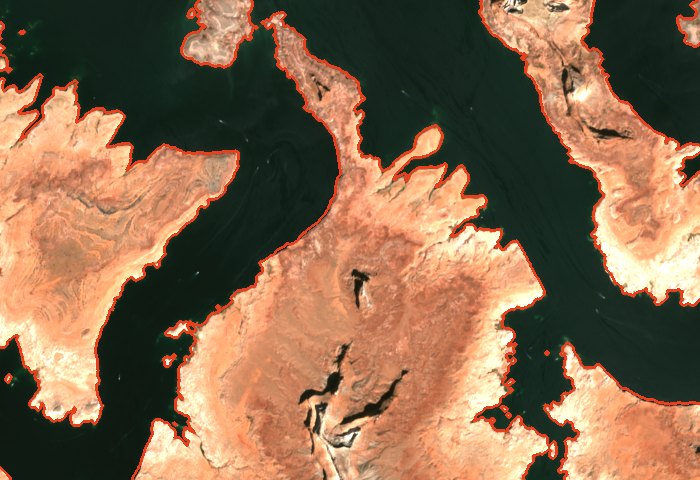
The same 7 × 4.8 km piece of Padre Bay on all five dates, in true colour. The red line is drawn from the terrain model alone, at the elevation fitted above — it has never seen the photograph underneath it.
Does it hold the right amount of water?
The shoreline test is blind to one thing: if the whole terrain model were shifted a few feet up or down, every date would simply fit a few feet off and the agreement would be just as good. The published elevation–area–capacity relation for Lake Powell (USGS SIR 2022-5017, the same source behind the storage figures in the app) measures exactly that, so it is worth flooding the model across its whole extent and weighing the result against it.
| Elevation ft | Every pixel below | Connected to the pool | Published | Naive | Ours |
|---|---|---|---|---|---|
| 3,700 | 179,973 | 158,287 | 161,300 | +11.6% | -1.9% |
| 3,680 | 163,729 | 143,186 | 151,200 | +8.3% | -5.3% |
| 3,660 | 148,935 | 129,455 | 140,800 | +5.8% | -8.1% |
| 3,640 | 135,357 | 116,749 | 130,100 | +4.0% | -10.3% |
| 3,620 | 121,063 | 103,273 | 119,200 | +1.6% | -13.4% |
| 3,600 | 100,504 | 83,359 | 108,100 | -7.0% | -22.9% |
| 3,580 | 91,685 | 75,915 | 96,500 | -5.0% | -21.3% |
| 3,560 | 82,888 | 68,179 | 84,600 | -2.0% | -19.4% |
| 3,540 | 74,718 | 60,819 | 72,400 | +3.2% | -16.0% |
| 3,522 | 67,733 | 54,518 | 61,200 | +10.7% | -10.9% |
| 3,500 | 59,846 | 47,324 | 49,500 | +20.9% | -4.4% |
| 3,490 | 56,462 | 44,205 | 43,200 | +30.7% | +2.3% |
| 3,450 | 45,014 | 33,671 | 28,400 | +58.5% | +18.6% |
| 3,370 | 26,494 | 17,800 | 9,100 | +191.1% | +95.6% |
The middle two columns are the two rules. Every pixel below floods the terrain and never minds what is joined to what; connected to the pool is what the app draws.
This table used to show the second column within a few per cent of the published one from 3,500 ft to full pool. That agreement was two errors cancelling. Where the sonar did not reach, the terrain's floor was 3DEP's flattened lake at 3,703 ft — 27,000 to 40,000 acres that never flooded at any level — and each zoom of the terrain had been blended into the sonar over sixteen pixels, which at this zoom smeared lakebed a few hundred metres up every canyon wall and flooded it. With both repaired the model holds 2 per cent less than the published figure at full pool and up to 23 per cent less at 3,600 ft, consistently less, which is a more honest disagreement than the old agreement was.
The photographs say where the difference lies. Taking every Sentinel-2 tile over the reservoir on three of the dates above, at the level each was fitted to, the model floods 2 to 5 per cent more than the photographed lake wherever the lake was photographed — and the photographed lake is smaller still than the published figure, by 13 to 25 per cent. Two independent measurements agree with each other and not with the table, so the terrain has been left alone; the table needs checking against the report itself. It is not beyond question elsewhere either: below 3,500 ft two of its intervals imply a surface area no monotone curve can have, so it is quoted here as published rather than as truth.
The dam
Getting that second column took putting the dam into the model, because it was not in it. The elevation data maps ground, and Glen Canyon Dam is a structure, so what the terrain holds at the dam site is whatever survived processing — and how much that is depends on how far you are zoomed in:
| Zoom | Ground sample | Lowest point across the dam axis |
|---|---|---|
| 9 | 244 m | 3,408 ft |
| 10 | 122 m | 3,297 ft |
| 11 | 61 m | 3,373 ft |
| 12 | 30 m | 3,428 ft |
| 13 | 15 m | 3,420 ft |
| 14 | 7.6 m | 3,450 ft |
| 15 | 3.8 m | 3,442 ft |
The real crest is 3,715 ft. At no zoom does the terrain hold full pool — the lidar now under the finest zooms is bare earth, which leaves the dam out entirely — so without help the reservoir runs through the dam site and forty kilometres on down Marble Canyon, drawn as lake.
The dam is carried as data now — an axis across the canyon and a crest, measured off the terrain at the finest zoom and burned into every tile as it decodes, so the barrier is the same at every scale. That alone does not fix it: the paint rule knows nothing of paths, and the canyon below the dam is still ground under full pool. So each pixel also carries the level at which it joins the pool behind the dam — computed once, offline, as the lowest of the highest points along any route from the forebay. Where the water simply rises over ground, that level is the ground; below the dam it is beyond anything the gauge can reach. The whole correction is zero almost everywhere, so it ships as 0.3 MB beside 560 MB of terrain, and the app pays one addition per pixel for it.
Is the pre-dam river a river?
The banks the map draws at low water are not simulated at all. They are read
off the seventeen 1:62,500 quadrangles that surveyed Glen Canyon before it
filled, by separating the blue plate — the ink the Colorado is drawn in.
scripts/trace_predam_river.py does the separating.
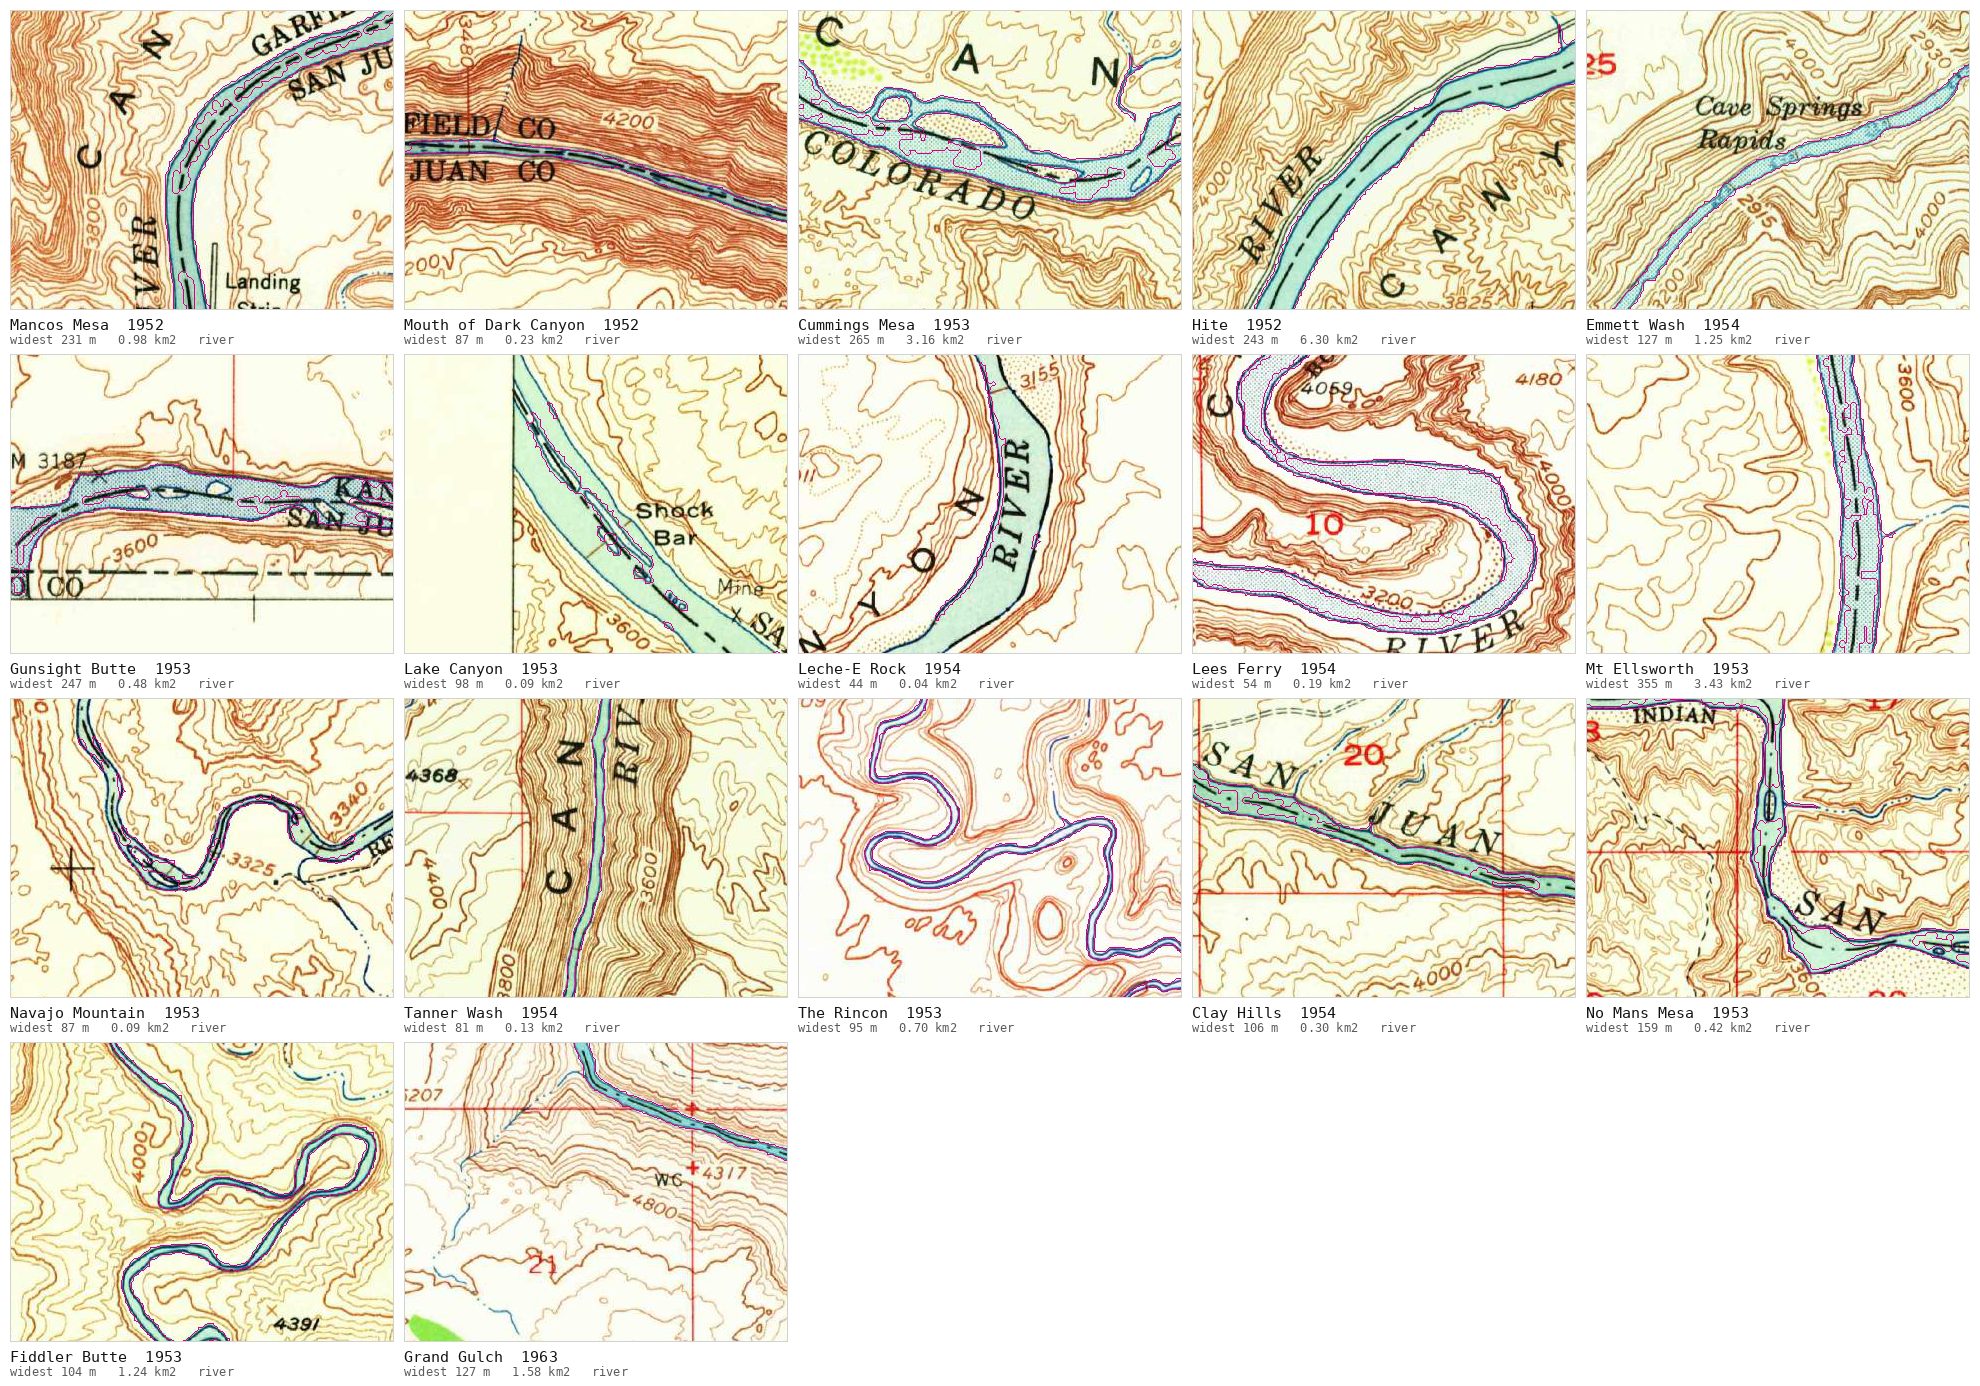
That is a measurement on pixels, and so is every check it makes on itself: how far the ink clears the paper, how wide the widest body is, how many square kilometres came out. All of them were satisfied, once, by a sheet with LAKE POWELL — NORMAL POOL ELEVATION 3700 tinted across the canyon in exactly the blue the river is drawn in. A quadrangle is surveyed once and printed many times, the collection dates a scan by its survey, and three reprints from the 1960s carried the reservoir onto sheets whose survey predates it. The statistics could not see it. Anyone looking at the sheet could.
So the check looks. scripts/validate_predam.py crops every sheet
where the tracer found its water, draws the detected boundary on the scan in a
colour no quadrangle was ever printed in, and lays the seventeen out together.
A reservoir cannot hide in it: the outline would run along a contour, around a
shape that fills the side canyons, under a number saying a kilometre wide.
What this does not prove
- The datum is converted, not closed. The terrain model is NAVD 88 — its land agrees with the 2022 lidar to within a foot — and the gauge is NGVD 29, 2.4 ft lower at the dam. The model is now shifted onto the gauge's datum as it is read, so every fitted elevation above is in the gauge's own terms; but it is one number, measured at the dam, and the sonar's own datum could not be read from here. Closing it takes one comparison against the gauge record at Glen Canyon Dam (USGS 09379900) for these five dates, which was unreachable from where this ran.
- One window, not the whole lake. The shoreline test covers 24 × 15 km of Padre Bay. It is the most complex shoreline in the reservoir, which makes it a hard test, but it is not the San Juan arm or Bullfrog.
- Some of the lakebed is inferred. Where the 2020 lidar saw water and the sonar never reached, the ground is known only to lie below that water. It is interpolated from the measured ground around it and capped at the water's level — a reasonable surface, not a measured one.
- Turbid water reads as land. The two weakest dates, April 2023 and September 2023, are both after inflow events, and their disagreement is concentrated in the sediment plumes at the canyon heads, where NDWI stops seeing water before the water stops.
Running it again
The study is two scripts in the repository, and it needs no credentials — the Sentinel-2 archive is public and open.
pip install -r scripts/requirements-validation.txt

# find cloud-free scenes over the lake
python3 scripts/find_scenes.py 12/S/VG 2026 9

# fit an elevation to one of them
python3 scripts/validate_shoreline.py \
  sentinel-s2-l2a-cogs/12/S/VG/2026/9/S2B_12SVG_20260903_0_L2A 3470 3670

# weigh the whole model against the published capacity curve
python3 scripts/validate_hypsometry.py

# rebuild the connectivity correction after changing a structure
python3 scripts/build_reservoir_fill.py

# redraw the plates from the fits
python3 scripts/validation_plates.py fit_*.json
Every number on this page, including the full fit curves, is in runs.json.